At SmartCapitalMind, we're committed to delivering accurate, trustworthy information. Our expert-authored content is rigorously fact-checked and sourced from credible authorities. Discover how we uphold the highest standards in providing you with reliable knowledge.
What is Infographics?
 Mary McMahon
Mary McMahon
Mary McMahon
Information graphics, also known as infographics, are a way of presenting information, data, or knowledge with the use of visual tools. They are quite ancient; early humans, for example, made maps and other visual representations of their lives which can be seen today. There are a wide range of modern uses for these graphics, from maps of subway systems to slides in a presentation given at a conference.
Many people are familiar with basic infographics, like weather maps, which have small symbols to indicate areas of low and high pressure, as well as predictions for snow, rain, and sunshine. Most people have probably also made one at some point in their lives if they've ever drawn out a quick map to help someone find a house or created a chart graphing data that they collected. These small units of visual information contain a lot of information when they are closely studied, and they organize that information in a very accessible way.

Some graphics are designed to be universally readable and accessible. For example, many people around the world recognize a red octagon as a stop sign. Other road sign graphics clearly illustrate things like T-intersections, areas of curvy road, and upcoming merges. Universal symbols like these are immensely helpful in areas where people speak many different languages, making signs such as ”merge ahead” impractical because the sign would not be universally understood. They are also sometimes used as communication tools; some travelers, for example, bring a chart with images of their basic needs that they can point to, asking for things like a bed, food, a phone, or water.

An infographic can also include verbal information. Many, like maps, have keys that are designed to explain all of the elements of the image, making it easier to understand. Others, such as subway maps, use words to designate each station, as well as bright colors illustrating the different routes. When charts are used to present data, they also typically have verbal information; the side of a bar graph, for example, might explain that one axis showed the number of people with cars, while the other side indicated which country the car owners lived in.

Visual presentation of information is a powerful tool. Sometimes a complex concept can be more quickly understood with the use of infographics than through words. The universal comprehension factor is also very valuable in a mixed group, and the use of graphics ensures that information will be accessible to people thousands of years in the future, who may not understand the system of written communication used; for example, nuclear waste disposal sites use symbols to explain that they are dangerous. These graphics have also been used in attempts to establish communication with alien races who might be able to understand drawings even if they can't comprehend human languages.
Mary McMahon
Ever since she began contributing to the site several years ago, Mary has embraced the exciting challenge of being a SmartCapitalMind researcher and writer. Mary has a liberal arts degree from Goddard College and spends her free time reading, cooking, and exploring the great outdoors.
Learn more...
Mary McMahon
Ever since she began contributing to the site several years ago, Mary has embraced the exciting challenge of being a SmartCapitalMind researcher and writer. Mary has a liberal arts degree from Goddard College and spends her free time reading, cooking, and exploring the great outdoors.
Learn more...AS FEATURED ON:
AS FEATURED ON:

-
![A graph is a type of infographic.]() By: Daniel CoulmannA graph is a type of infographic.
By: Daniel CoulmannA graph is a type of infographic. -
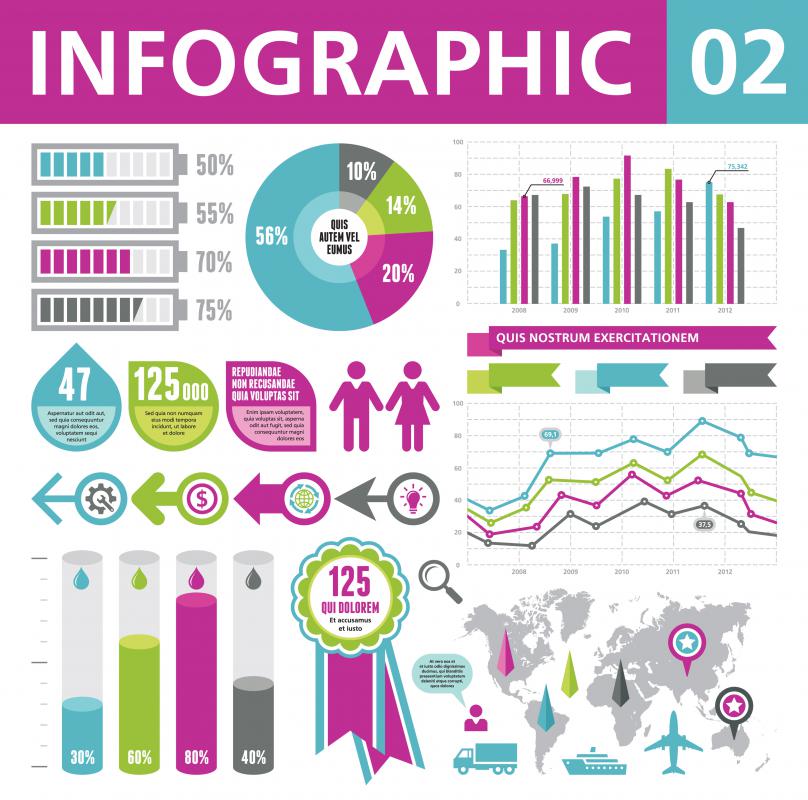
![An example of a modern infographic.]() By: serkorkinAn example of a modern infographic.
By: serkorkinAn example of a modern infographic. -
![A world map is a type of infographic.]() By: tovovanA world map is a type of infographic.
By: tovovanA world map is a type of infographic. -
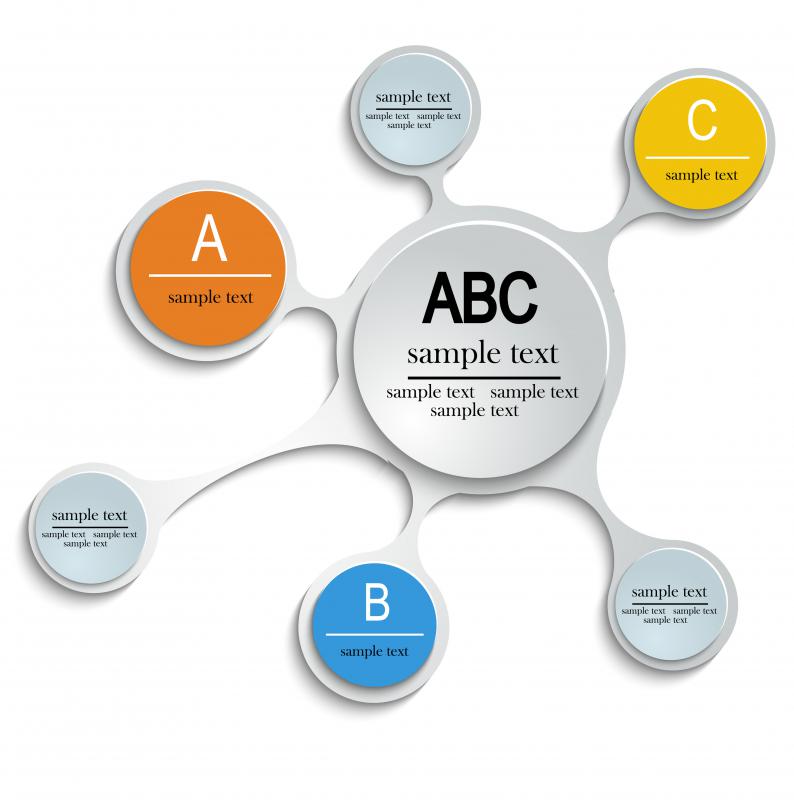
![An example of an infographic.]() By: kaidashAn example of an infographic.
By: kaidashAn example of an infographic.


Discuss this Article
Post your comments